

 |
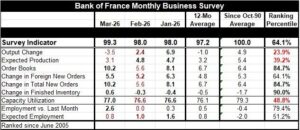
The overarching survey indicator for March stepped up despite enhanced global challenges. The March headline index rose to 99.3 from 98 in both January and February.
The March level of the headline compares to a 12-month average of 97.2. Nearly all the components in March are above their 12-month averages. The exception is the output change, which is substantially weaker than its 12-month average. Expected production, at 3.1 in March, is just a tick below its 12 month average of 3.2. Finally, expected employment in March is tied with its 12-month average.
In addition, only 3 readings weaker month-to-month in March were output change, expected production, and expected employment.
On the month, output change is a weak reading, falling by 3.5 points month-to-month; it may be the clearest example of the report showing weakness ahead, affected by upcoming global issues related to the war and rising oil and energy prices.
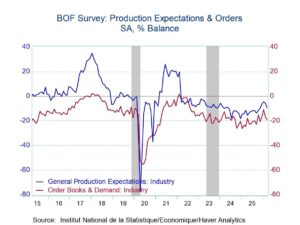
In addition to output change, expected production slipped to 3.1 in March from 4.8 in February. There was also a step back in expected employment, a modest one to 0.8 in March from 1.0 in February.
But order books showed a 10.2 reading in March, up from 5.6 in February. Changes in new foreign orders and total orders both showed more strength in March than in February, with foreign orders at 5.5 in March compared to 5.2 in February. The change in total orders, at 10.2 in March, was much stronger than 5.6 in February. Inventories registered 0.6 in March, up from -0.3 in February.
However, capacity space is being used up as capacity use rose to 77.0 in March from 76.6 in February.
The employment metric at 2.6 in March was much stronger than its zero reading in February.
On balance, the components indicate the sector is moving ahead as the headline gain suggests in March. But the major question mark is probably the strength in orders—which we take to be forward-looking compared to the setback in output change.
The index in March has a 64.1 percentile standing. Only three components in March ranked below their respective 50% marks (below their medians). The strongest readings generated standings in the 90th and mid-80th-percentile levels. These included finished inventories, the change in total orders, and order books. The lagging components, below their median values, were output change, expected production, and capacity utilization.
The French industrial readings are surprising for their resilience.
 |
Comments are closed.