

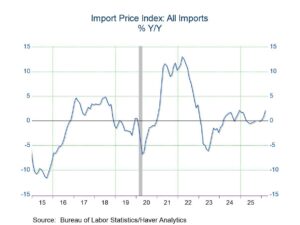
- Despite a 9.4% m/m jump in imported petroleum prices, import prices rose a less-than-expected 0.8% in March with a small downward revision to February.
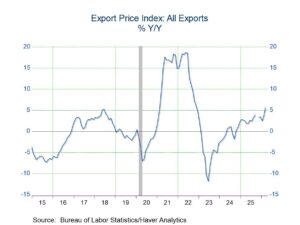
- Export prices increased more than did import prices, rising 1.6% m/m in March, but this was also less than expected.
 |
 |
Import prices rose a less-than-expected 0.8% m/m (2.1% y/y) in March notwithstanding a 9.4% monthly jump in imported petroleum and petroleum products prices, according to the Bureau of Labor Statistics. The 1.3% m/m increase previously reported for February was revised down to a 0.9% monthly gain. The Action Economics Forecast Survey looked for a 2.4% m/m increase in March. Export prices rose more than did import prices but also less than expected. They were up 1.6% m/m (5.6% y/y) in March following an upwardly revised 1.9% monthly rise in February. The 5.6% annual gain was the largest since November 2022. The Action Economics Forecast Survey expected a 2.1% monthly increase. (Note: Import and export price indexes are not directly affected by tariffs because they measure the prices of goods before taxes. Tariffs are classified as taxes and therefore are excluded from these calculations. October 2025 data were unavailable due to the U.S. federal government shutdown.)
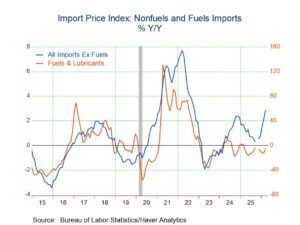
Apart from the jump in imported petroleum prices, increases in other import prices were rather moderate in March. Import prices for fuels and lubricants increased 2.9% m/m in March, following an advance of 2.4% in February. The March increase was the largest monthly gain since the index rose 3.0% m/m in January 2025. Higher prices for petroleum more than offset lower prices for natural gas. In March, prices for imported petroleum and petroleum products advanced 9.4% while natural gas import prices declined 71.0% m/m in March, after having risen 77.3% over the prior three months. Prices for nonfuel imports advanced 0.6% m/m in March, following a rise of 0.8% m/m in February. Higher prices for nonfuel industrial supplies and materials (1.6% m/m), capital goods (0.5% m/m), consumer goods excluding automotives (0.4%), and foods, feeds, and beverages (0.5%) drove the increase. Nonfuel import prices advanced 2.8% y/y, the largest annual advance since the index rose 2.9% y/y in October 2022.
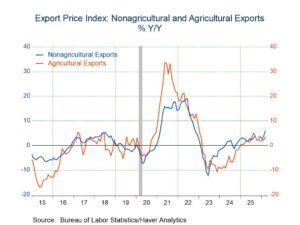
The March increase in exports prices reflected monthly gains in both agricultural and nonagricultural export prices. The price index for agricultural exports increased 0.9% m/m in March, following a 0.9% monthly rise in February. Higher prices for soybeans, fruit, and meat drove the advance in agricultural export prices in March. Export prices for nonagricultural commodities increased 1.7% m/m in March, after rising 2.1% in February. Higher prices for nonagricultural industrial supplies and materials (+4.3% m/m, reflecting an 18.4% monthly jump in prices of petroleum and petroleum products) more than offset lower prices for capital goods (-0.2% m/m) and for consumer goods excluding automotives (-0.2% m/m).
These import and export price series are not seasonally adjusted; they can be found in Haver’s USECON database. Detailed figures are available in the USINT database. The expectations figure from the Action Economics Forecast Survey is in the AS1REPNA database.
 |
 |
Comments are closed.